

📌 The Moment I Knew Our Analytics Was a Mess
I still remember the exact moment it hit me.
It was my first week at a fast-growing SaaS startup. I was pumped—finally, I’d get to analyze user behavior, uncover insights, and drive product decisions with data.
I fired up my laptop, eager to dig in… and found nothing.
❌ No proper event tracking.
❌ No dashboards just raw SQL queries that nobody understood.
❌ No clear ownership—just scattered reports in random folders..
Then, just as I was absorbing this, my VP dropped a bombshell:
"We need to figure out why engagement is dropping—our CEO needs it for an investor presentation."
I had no clue what the product even did yet. I hadn’t even been onboarded properly. And now, I was expected to deliver a high-stakes analysis with data that didn’t exist.
This wasn’t just a one-time problem. As I worked through it, I realized it was a pattern. Everything is fine—until suddenly, investors, executives, and product teams start demanding numbers. That’s when reality hits.
💰 "We just raised funding… why is our data such a mess?"
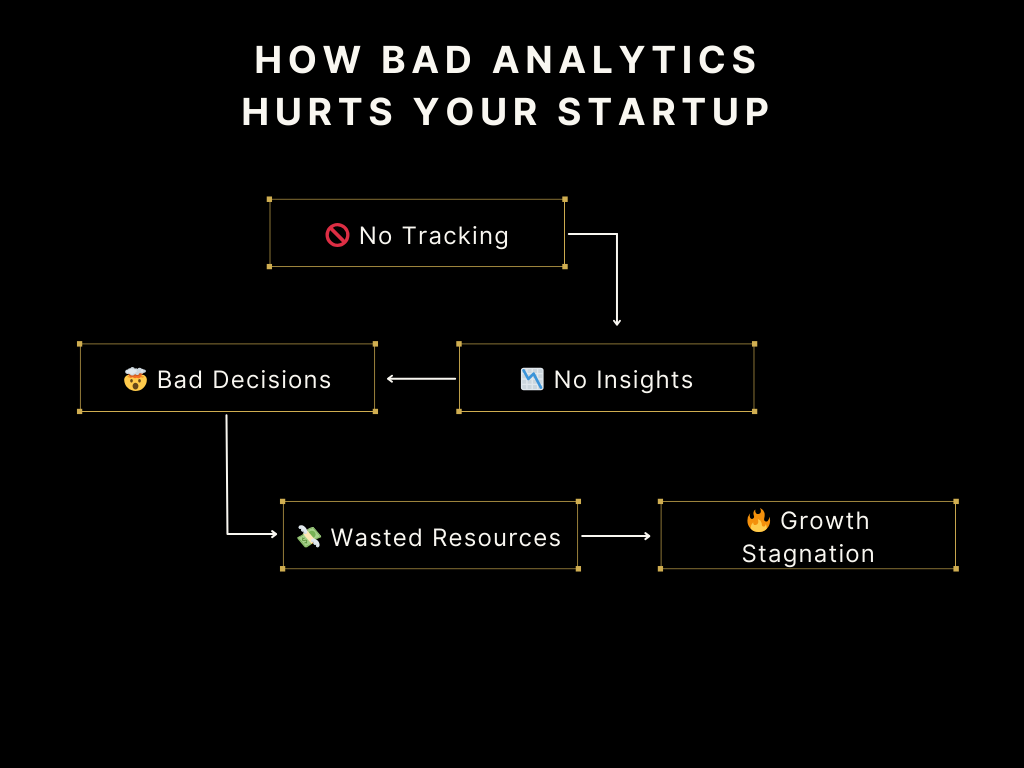
🔥 The True Cost of Bad Product Analytics
For a while, a messy data setup might feel like just a minor inconvenience. Teams work around it. PMs guess instead of analyze. Data teams get flooded with requests but somehow keep moving forward.
Until one day, they don’t.
At some point, the cost of bad analytics becomes too big to ignore.
💸 Wasted Time and Burnout
One of the first signs of a broken analytics system is how much time is wasted fixing instead of analyzing.
- Engineers waste weeks fixing broken tracking instead of shipping features.
- Analysts spend 80% of their time running the same ad-hoc reports instead of generating strategic insights.
- Data scientists, who were hired to build predictive models, get stuck doing basic reporting work because the infrastructure isn’t there.
It’s frustrating, inefficient, and a massive waste of talent.
“We hired a data scientist to build models. Instead, they spend most of their time cleaning up event tracking.”
I’ve heard this line more times than I can count.
🤯 Decision Paralysis: When Leadership is Flying Blind
Product and growth teams are supposed to be data-driven, but in reality, they’re data-deficient.
🚫 Experiments don’t get run because nobody trusts the numbers.
🚫 Feature success can’t be measured because there’s no baseline data.
🚫 Retention and churn analysis is impossible because tracking is incomplete.
So what happens?
PMs and executives start making major product and growth decisions based on gut feeling. They take bets instead of analyzing trends. Some of these bets work—but many don’t. And every bad decision made due to poor analytics costs the company revenue, retention, and growth.
"We just need a dashboard that tells us what’s happening."
Reality: There’s no clean data to build that dashboard in the first place.
😡 Stakeholder Distrust: When Teams Stop Believing in Data
Over time, something even worse happens.
People stop trusting data altogether.
PMs no longer believe in A/B test results.
Marketing doesn’t rely on attribution reports because they’re always changing.
Leadership assumes engagement numbers are inaccurate because they keep fluctuating.
Without trust, teams default to working around the problem. Instead of using data to guide decisions, they go back to intuition. Instead of building dashboards, they request one-off reports whenever they need numbers—creating an endless cycle of inefficiency.
A self-serve analytics culture never happens because the data is too messy for anyone to use on their own.
📉 Investor Red Flags: When Bad Data Costs You Funding
Messy analytics doesn’t just slow down teams—it can hurt your company’s valuation.
When raising funding, investors will ask tough questions:
❓ What’s your activation rate?
❓ How do you define an engaged user?
❓ What’s your retention curve?
❓ What’s your LTV, and how do you calculate it?
If your answers are unclear or inconsistent, it signals risk. And risk lowers valuations.
I’ve seen startups struggle through fundraising because they couldn’t confidently explain their own metrics.
"If you don’t understand your own numbers, why should we invest?"
🔍 Why Startups Keep Getting Stuck in This Mess
If you’re leading a SaaS startup, you probably think you’re building a data-driven company. You’ve invested in a few analytics tools, hired a data analyst, and maybe even set up some dashboards.
But then, reality kicks in.
Product managers keep asking for reports.
Growth teams struggle to measure experiment results.
Engineers get pulled into debugging tracking issues.
And worst of all? Nobody actually trusts the data.
This cycle repeats itself across countless startups. Despite the best intentions, analytics often falls apart before it even starts working. But why?
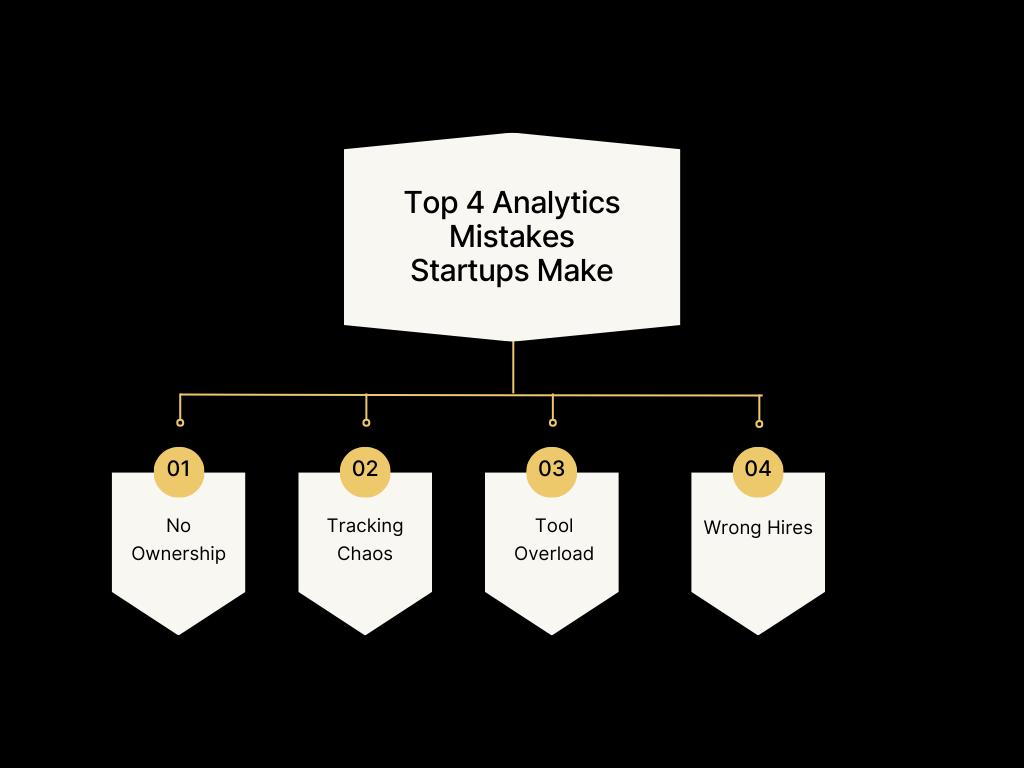
1️⃣ No One Owns Analytics—So It Stays Broken
At early-stage startups, data is everyone’s problem… which means it’s no one’s responsibility.
- Engineers build pipelines, but they aren’t defining what to track or why it matters.
- PMs and growth teams rely on data but don’t know how it’s being collected.
- Analysts get dumped with endless requests but have no control over data quality.
This creates an accountability gap, where analytics sits in limbo between product, engineering, and marketing.
Instead of treating data like a core function—just like design or engineering—it becomes a messy, ad-hoc project that no one fully owns.
And when no one owns analytics, it falls apart.
2️⃣ Tracking Chaos = No One Trusts the Data
Ever tried pulling a report only to realize the numbers don’t add up? Or worse—different teams are reporting different numbers for the same metric?
This happens because event tracking is a disaster at most startups.
Here’s what typically goes wrong:
❌ No standard naming conventions – One team calls it click_signup, another calls it signup_click. Who’s right? Nobody knows.
❌ Duplicate tracking across different tools – The same user action gets logged in Amplitude, Mixpanel, Google Analytics, and Segment… but they all show different numbers.
❌ No documentation – Engineers add tracking based on what they think is needed, but nobody writes it down. Months later, no one remembers what’s being collected or how.
And here’s the worst part:
🚨 If your tracking is broken, every analysis that follows is garbage. 🚨
It doesn’t matter if you have dashboards, SQL queries, or AI-powered insights—if your raw data is messy, your insights will be completely unreliable.
The result? Nobody trusts the numbers.
- PMs stop relying on reports and go with their gut.
- Growth teams struggle to run experiments.
- Investors ask tough questions, and you hope your metrics are right.
Without clean, structured tracking, analytics becomes a guessing game.
3️⃣ Buying Tools Without a Strategy = Burning Money
Startups love buying analytics tools.
📊 “Let’s get Looker so we can centralize reporting.”
📊 “Amplitude will help us measure user behavior.”
📊 “Segment will fix our tracking problems.”
So they invest in:
- Looker for BI dashboards
- Amplitude for product analytics
- Segment for data pipelines
- Tableau for reporting
- BigQuery for data warehousing
Each tool promises to solve a different analytics problem—but without a clear data strategy, they just create more complexity.
Instead of fixing tracking issues, startups end up:
- Manually stitching together reports from different platforms
- Confusing teams with multiple dashboards that don’t match
- Spending thousands on tools they don’t fully use
Tools don’t fix bad data. A broken tracking system plugged into expensive analytics software is still broken.
If you don’t have a clear analytics strategy, all the tools in the world won’t help you.
The Bottom Line
Most SaaS startups fail at analytics because they:
🔸 Don’t assign clear ownership—so nobody fixes broken tracking.
🔸 Let tracking get out of control—so nobody trusts the data.
🔸 Buy expensive tools too soon—so analytics becomes even more fragmented.
The result? A mess of unreliable reports, frustrated teams, and data that isn’t useful when you need it most.
The good news? You can fix it.
The first step? Stop treating analytics like an afterthought—and start treating it like a core part of your business.
🚀 How to Fix Your Product Analytics (Before It’s Too Late)
Messy analytics isn’t just a technical problem—it’s a structural problem.
Startups don’t fail at analytics because they lack data. They fail because data is scattered, tracking is inconsistent, and no one truly owns it.
You don’t fix this by just hiring more analysts or buying more tools.
You fix it by changing how the company thinks about data.
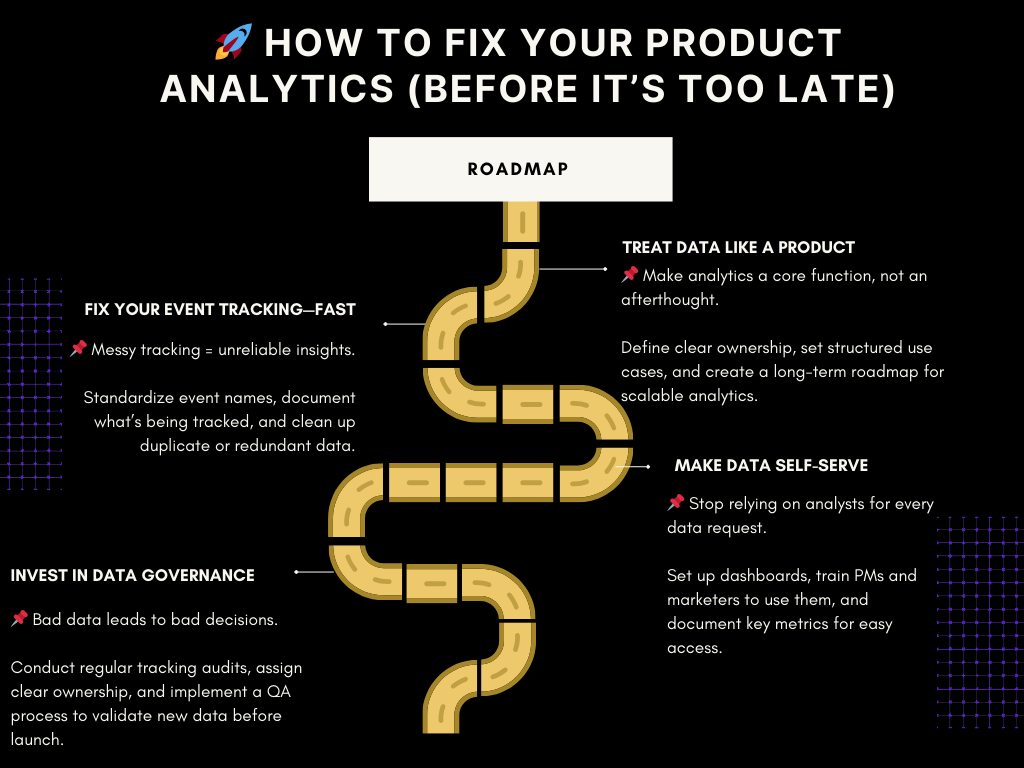
1️⃣ Treat Data Like a Product
Most startups treat analytics like a side project. That’s a huge mistake.
Your data infrastructure should be designed with the same level of intention as your actual product.
That means:
📌 Clear ownership – Who is responsible for maintaining and improving analytics?
📌 Defined use cases – Who needs what data, and for what decisions?
📌 A structured roadmap – What’s broken now? What needs fixing next? What’s the long-term vision?
If your company is constantly reacting to analytics issues instead of proactively designing a system, you’re already behind.
Data isn’t something you fix once and forget—it’s an evolving system that needs ongoing management and iteration.
2️⃣ Fix Your Event Tracking—Before It Breaks Everything Else
The biggest reason startups struggle with analytics? Bad tracking.
Here’s what typically happens:
- Engineers implement tracking on the fly with no clear taxonomy.
- PMs ask for new events but don’t know what’s already tracked.
- Data teams get conflicting numbers from different sources.
It doesn’t take long before every report looks different, every analysis is questioned, and no one trusts the data.
🚨 If tracking is broken, everything downstream—dashboards, reports, experiments—will be unreliable.
How to Fix It
✅ Create a tracking plan – Standardized event names, clear data structures, and a single source of truth.
✅ Track only what matters – Collect data with intention. More events ≠ better analytics.
✅ Audit your existing events – Clean up duplicates, remove unused tracking, and ensure consistency.
A strong event taxonomy isn’t optional—it’s the foundation of a data-driven company.
3️⃣ Make Data Self-Serve (So Analysts Can Stop Being Human SQL Interfaces)
If every product or marketing question requires an analyst to pull data, your company is moving too slowly.
A mature analytics setup allows teams to find answers on their own—without waiting for someone to write a query.
Here’s how to get there:
🔹 Set up self-serve dashboards in Looker, Amplitude, or Mixpanel.
🔹 Train PMs and marketers to use these tools effectively.
🔹 Write clear documentation so people stop asking, “Where do I find this metric?”
The goal isn’t just data access—it’s data confidence.
A self-serve culture means:
✔ PMs can track feature adoption without asking for a report.
✔ Growth teams can analyze retention without waiting on an analyst.
✔ Executives can pull real-time numbers without questioning their accuracy.
When data is easily accessible, teams stop relying on gut feelings and start making faster, smarter decisions.
4️⃣ Invest in Data Governance & Quality Control
Bad data is worse than no data. If teams stop trusting analytics, they stop using it—leading to decisions based on instinct instead of insights.
Data quality isn’t just about fixing mistakes—it’s about preventing them. To ensure long-term reliability, analytics must have a structured, ongoing review process.
🔄 Quarterly Data Health Checkups
To prevent data drift and tracking failures, teams should conduct regular audits of key analytics components:
✅ BI Model & Key Metrics Review – Ensure core tables and fields are receiving accurate data. Validate activation rates, revenue tracking, and other key indicators.
✅ Dashboard & Reporting Audits – Verify that Looker or Amplitude dashboards reflect the correct data. If numbers look off, investigate tracking or pipeline issues.
✅ Anomaly Detection – Set up automated alerts for unusual trends (e.g., sudden drops in activation or spikes in churn).
✅ Event Tracking Cleanup – Remove redundant or outdated events that create noise and clutter reports.
✅ Ownership Review – Ensure PMs, analysts, and engineers own their part of the data stack and can act when issues arise.
💡 Make Data Quality a Built-In Process
📌 Engineers should unit test tracking events – Validate analytics implementation just like any other feature.
📌 PMs should own logical validation – Analysts can’t catch every issue—PMs should confirm that the right events track the right behaviors.
📌 Analysts should be SMEs, not event fixers – Their focus should be on strategy and insights, not constantly debugging tracking issues.
📌 Every new tracking event should be QA’d before deployment – Testing in staging prevents bad data from polluting reports.
A company that doesn’t trust its data will always be guessing.
By making data governance a routine process, your team can confidently rely on analytics—without second-guessing every report.
🚀 Ready to Fix Your Analytics? Let’s Talk.
If your team is struggling with broken tracking, inconsistent reports, and unreliable data, it’s time to take action.
A clean, structured analytics setup means faster decisions, better insights, and fewer wasted hours on manual reports. It ensures that your data works for you—not against you.
📩 Book a free audit of your analytics setup. Let’s identify the gaps and build a system that actually fuels growth.

